About this report
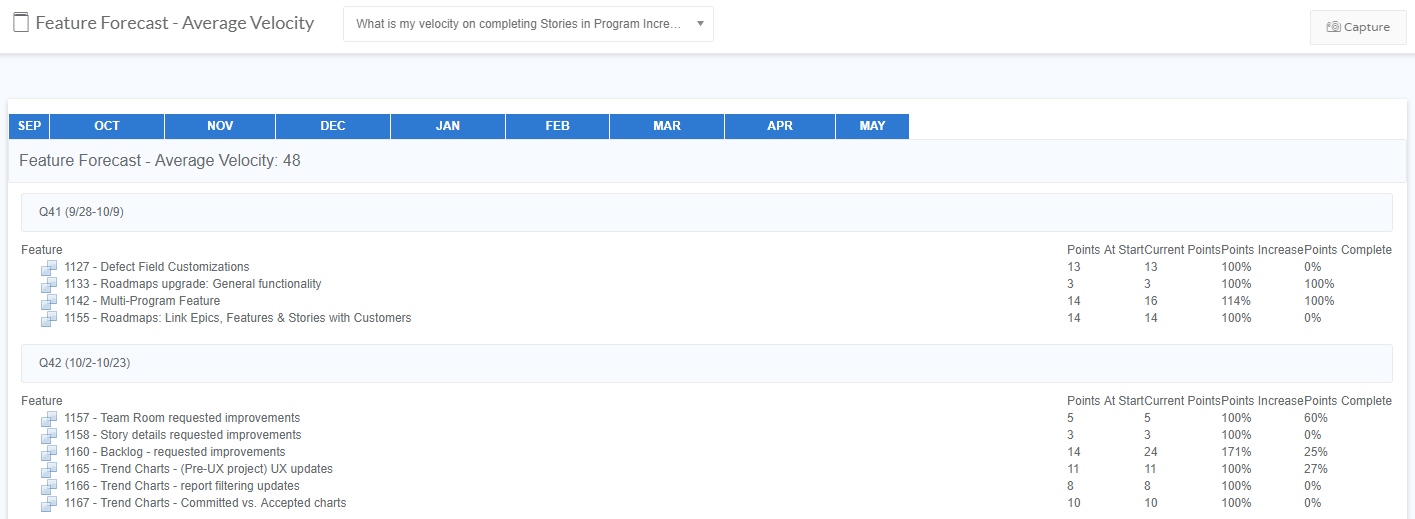
With the Feature forecast report, you can track how much work in story points is done on features in each sprint, how much work is left, and if there is enough capacity to finish all features in a PI. This report is beneficial to RTEs, product managers, and feature owners.

To navigate to this report:
- Select a program from the Teams dropdown in the top navigation bar.
- On the sidebar, select Reports in the list of options.
- Select Feature forecast - average velocity; the report displays.
Prerequisites
- Portfolio must be created in the system.
- Program must be created and tied to a portfolio.
- Program Increment (PI) must exist in the system and be tied to a program.
- Sprints must exist in the system and be tied to a team.
- Epics must be created and tied to the PI.
- Features must be created and tied to epics.
- Stories must be created with LOE and tied to features.
How are report values calculated?
During the PI planning meeting, the main backlog of stories and features is created. That’s why you can see the Points at Start column in the report. As sprints start, other stories can be added, which is reflected in the Current Points column. You can see this scope increase in the Points Increase column. And you can see how many points are complete out of total in the Points Complete column.
- Timeline = Time scale for the selected PI based on its start date and end date.
- Points at Start = Total LOE on stories for the feature at the beginning of the sprint.
- Current Points = Total LOE on stories for the feature as of the current date.
- Points Increase = Percentage of points added since the sprint start, calculated as: (Current Points - Points at Start) / Points at Start * 100.
- Points Complete = Percentage of total LOE on accepted stories for the feature.
How to interpret this report
You can view a list of features for the selected PI broken down by sprints. Under each feature, you can view the total story points for the feature and the story points complete, and then you can count how many points are left to complete. Looking at how many points are left to complete, how many sprints are left, and at the program average velocity provided in the report, you get the idea of how much work actually can be completed in the PI and if you are on track.
Join the Atlassian Community!
The Atlassian Community is a unique, highly collaborative space where customers and Atlassians come together. Ask questions and get answers, start discussions, and collaborate with thousands of other Jira Align customers. Visit the Jira Align Community Collection today.
Need to contact Jira Align Support? Please open a support request.