The product room is a centralized dashboard for Product Managers to tie investment back to vision, ensure strategic alignment, and track all work in process from one comprehensive view. It provides a better experience for Product Managers throughout Jira Align by making Product a first-class citizen. The product room serves as an information radiator for all facets of your products, including effort distribution, theme effort distribution, effort vs. value, and delivery statistics.
To navigate to the product room:
- Select Product in the top navigation bar and select the product you want to view information about; the product room displays.
Note: When on another product page, select Product room (beta) from the list of options on the sidebar to get back to the product room.
Prerequisites
- Portfolio must be created in the system.
- Program must be created and tied to a portfolio.
- Personas must exist in the system and be tied to a product.
- PIs and release vehicles must exist in the system.
- Themes must be created, tied to the PI, and have % allocations per program set up.
- Epics must be created, tied to themes and the PI, and have an estimate set for the PI.
- Features must be created and tied to the epics, PIs, products, and product objectives.
- Stories, with point values, must be created and tied to features.
- Teams must be created for the program.
- At least one sprint must be completed with completed story points for at least one team.
- Team members must be assigned to the completed sprint(s) and have allocations set for the sprint(s).
- The team burn hours setting must be set to indicate average daily hours a team member works.
- The teams must have the proper track by setting selected, either:
1. Track by Hours, for teams that are using tasks under stories and entering hours against them.
2. Track by Points, for teams that are only using story points and not tracking hours against tasks. - An hourly rate must exist. Depending on the portfolio setting for Costing Method, either:
1. A blended rate, which is entered on the PI.
2. Cost center rate, which is determined by the cost centers assigned to the team members.
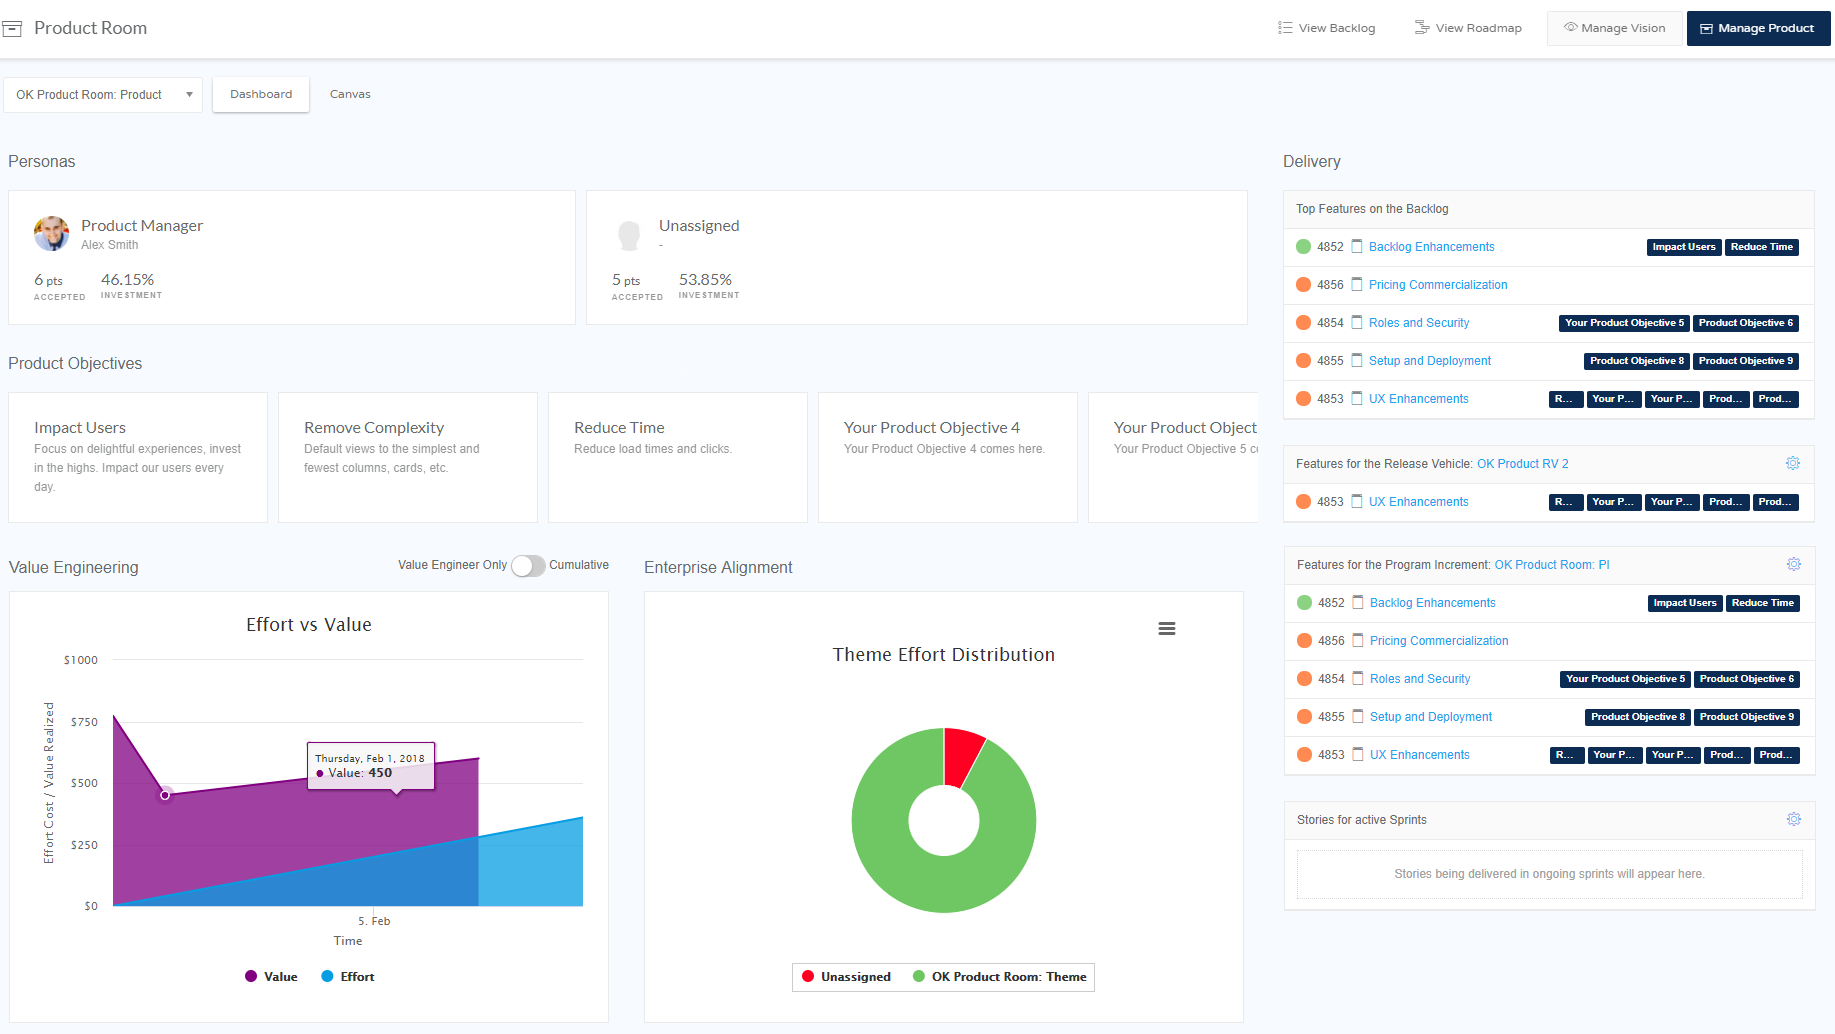
Dashboard
On the toolbar, you can use direct links to go to a feature backlog and product roadmap filtered by the selected product, as well as the product details panel.
Investment distribution by persona
View effort rollup by persona tied to the product and ensure work is being executed against the audience your product is addressing.
Personas associated with the selected product appear here. Unassigned are stories under features associated with the product but without a persona.
- Accepted = Accepted story points from all stories under features associated with a given persona.
- Investment = Percent of the total LOE story points: add up all LOE story points associated with the product and its children, take the LOE story points associated with the particular persona, and then divide to get the LOE invested in each persona. Stories do not have to be accepted when calculating this investment.
Delivery
Track work in flight across the organization for full transparency into what is being worked on, what is up next, and what might be at risk. Always know where the work is.
- Top Features in the Backlog are the features tied to this product in your backlog. You can view their state, name, and product objectives tied to them. This shows you exactly what you would see in the backlog taking into account your portfolio/program/program increment/release vehicle/product selections.
- Features for the Release Vehicle are the features planned to be delivered in ongoing release vehicles. By default, the features are filtered by a release vehicle with the closest end date. You can view their state, name, and product objectives tied to them. Click the gear icon to select a different release vehicle.
- Features for the Program Increment are the features planned to be delivered in ongoing program increments. By default, the features are filtered by a PI with the closest end date. You can view their state, name, and product objectives tied to them. Click the gear icon to select a different PI.
- Stories for Active Sprints are the stories being delivered in ongoing sprints. This shows all stories for all sprints that are currently in progress for the selected product. You can view stories’ state, name, and related team. Click the gear icon to select any other future sprints.
Effort vs. value
Track effort rollup against realized value. The Cumulative view renders a full burnup across all points tied to this product. It shows an effort point burnup against a value point burnup.
Theme effort distribution
Ensure your product aligns with the strategic themes of your organization and align your localized product strategy with the priorities of the Enterprise.
This pie chart shows the percentage of efforts invested in each theme. The effort is counted by the number of features associated with the product. The Unassigned section includes the features that are not associated with any theme.
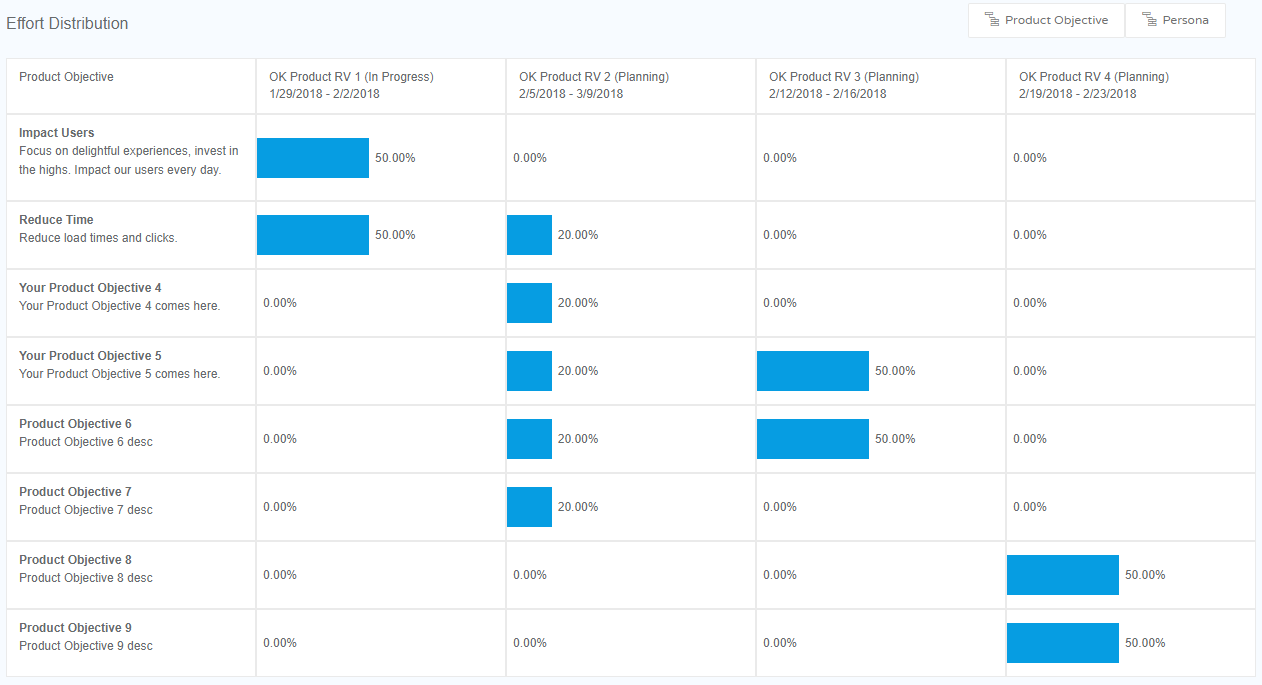
Effort distribution
Track real-time investment by release vehicle across personas and quickly identify where efforts are focused. This table shows the percentage of points associated with a given persona out of total assigned points.
Personas show effort distribution across personas.
- Y-axis = Personas.
- X-axis = Release vehicles in chronological order by their end date. This shows the latest delivered release vehicle, all release vehicles in progress, and the upcoming release vehicle with features tied to the product.
- Each cell = Percentage of story points assigned to the given persona in the given release vehicle.
- Other Personas/Unassigned = Percentage of story points assigned to the given persona in the given release vehicle but not assigned to products.
See also
Join the Atlassian Community!
The Atlassian Community is a unique, highly collaborative space where customers and Atlassians come together. Ask questions and get answers, start discussions, and collaborate with thousands of other Jira Align customers. Visit the Jira Align Community Collection today.
Need to contact Jira Align Support? Please open a support request.