About this report
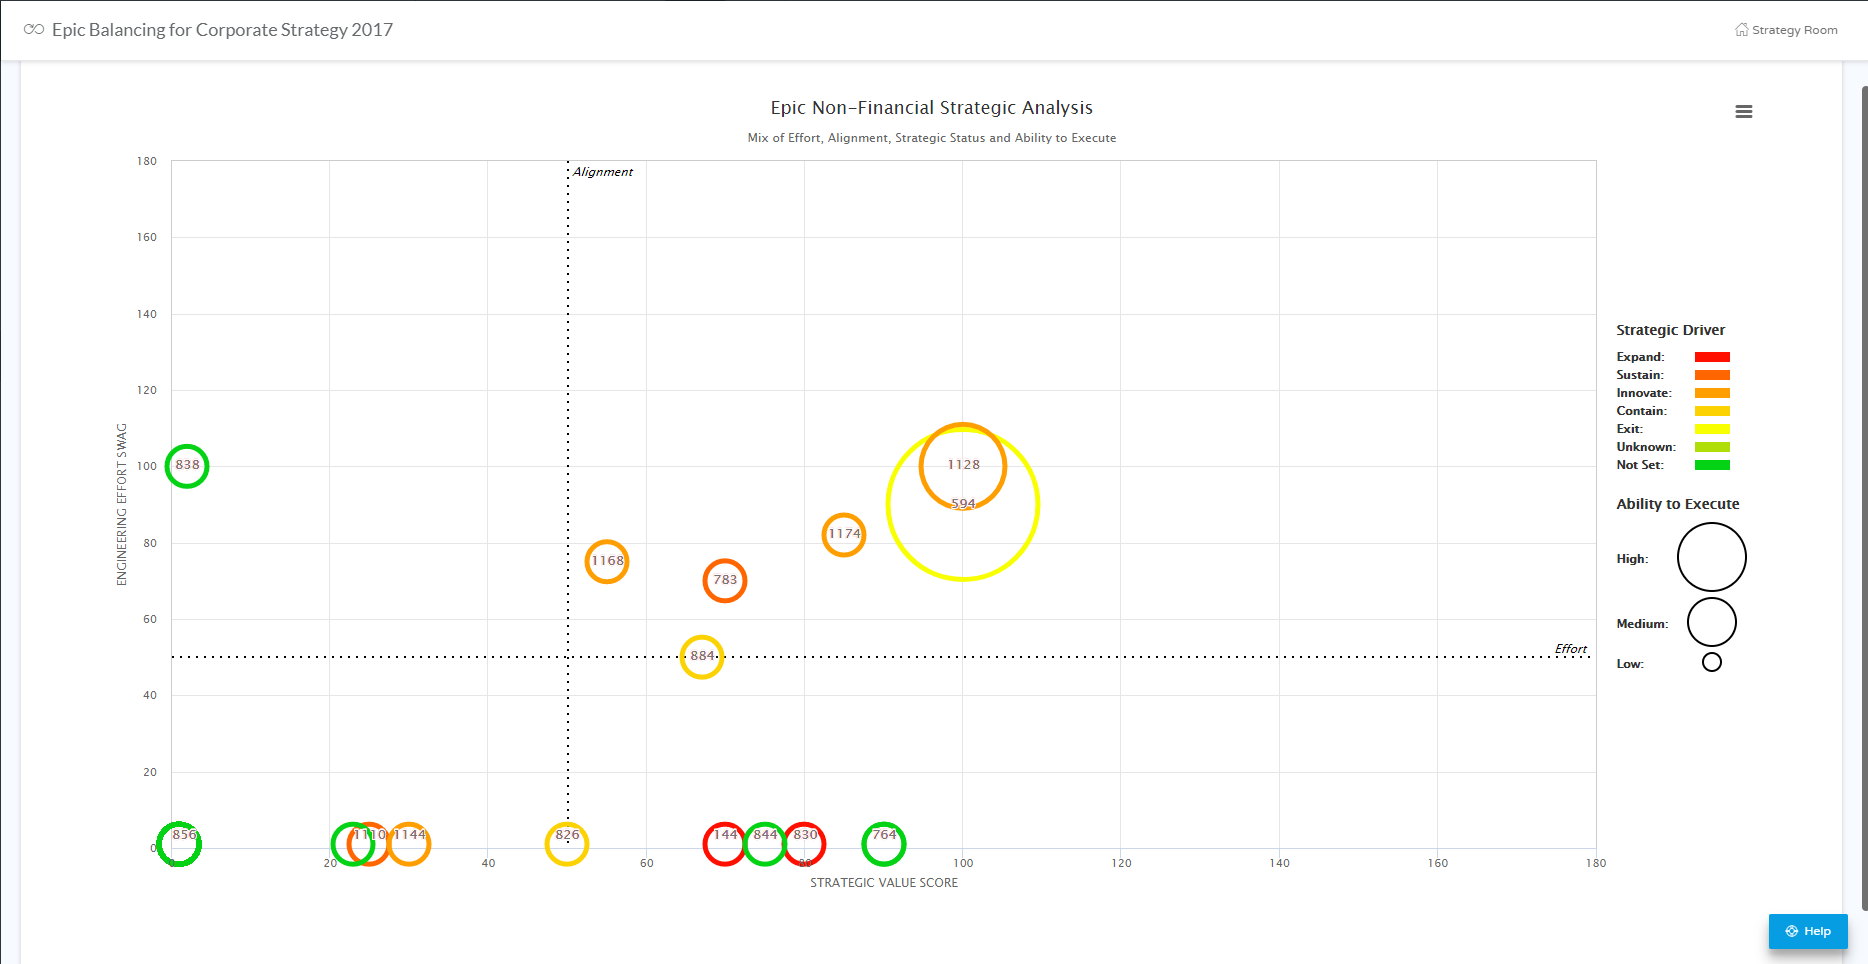
The Epic Balancing report is bubble chart that displays a non-financial strategic analysis of epics. The report is generated based on configuration selections made in the Configuration bar (Tier 1). Each epic tied to the selected configuration displays on the chart in the form of a bubble; the position, size, and color of the bubble is determined by the following data values:
- X Axis = effort
- Y Axis = strategic value
- Bubble color = strategic driver
- Bubble size = ability to execute
Be sure to view the legend on the right side of the page for a full explanation of bubble colors and sizes.
Hover over a bubble to see effort and alignment values for the epic, or double-click a bubble to open the Epic panel for editing/balancing the values.
Prerequisites
- Epics must exist in the system and be tied to primary program; the following four parameters must be filled out for each epic via the Details panel: Strategic Value Score, Effort SWAG, Strategic Driver, and Ability to Execute.
How are report values calculated?
The Strategic Value Score, Effort SWAG, Strategic Driver, and Ability to Execute values are all pulled directly from each epic; entered on an epic's Details panel.

How to interpret this report
Look in the lower-right quadrant for large bubbles--these represent epics that are low effort with a high value and high ability to execute. Large bubbles in the upper-right quadrant also have a high value and high ability to execute, but will require a higher effort.
Join the Atlassian Community!
The Atlassian Community is a unique, highly collaborative space where customers and Atlassians come together. Ask questions and get answers, start discussions, and collaborate with thousands of other Jira Align customers. Visit the Jira Align Community Collection today.
Need to contact Jira Align Support? Please open a support request.